Wait, wait, wait. ChatGPT can do Pipeline Conversion?

I had the privilege of speaking with more than a dozen executives in the past week about AI and its impact on business and education. We talked a lot about prompting, use cases, custom instructions, ADA, the role of AI in education, the role of AI in business, and much more. I shared many of the ways I personally use the various AI tools (ChatGPT, Claude, Bing, Bard, Midjourney, and more) in my daily workflow, and it always led to a conversation of “But can it do X?”
Most of you know that I’ve spent the last several years leading RevOps teams in different tech companies, and one of the questions I often get is, “How could I use this in my role today?” This came up again today with a close colleague (thanks, Cagg!), and I thought I’d show a great example of what ChatGPT’s Advanced Data Analysis (ADA -- formerly ‘Code Interpreter’) can do today.
The question was – “We look at pipeline conversion by source every quarter to understand if it’s going up or down, how it’s changing, etc. I’ve got a team of data analysts in XXX country that basically crunches a huge amount of data every quarter for me, but the structure of the reports never changes. Could any of the AI’s do what they do today?”
The short answer is yes. The most interesting part, though - isn’t just that ADA can just crunch numbers – we all know it can do that – the interesting part is that you can ask a more complicated question about the data in plain text (with a lot of detail) – and ADA can figure out how to create the calculation and then do that analysis.
PIPELINE CONVERSION
Let’s talk about pipeline conversion – something RevOps teams should be looking at all the time. Pipeline conversion looks at all the pipeline created in a certain time period (let’s say Q12023) and how much of that has closed through a certain time period (say today). Let’s say that $100,000 of the new pipeline was created in Q12023, and $28,000 has closed won by today – then the conversion rate is 28% ($28,000 / $100,000). There’s no built-in formula in the Python language (that I’m aware of) that allows you to just say, “Please calculate the pipeline conversion rate.”)
So what do you do? Let’s say you have a data set (this is very simplified) that looks something like this:
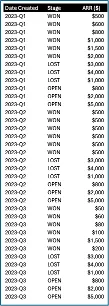
You have deals covering three different quarters with information on deals that are won, lost, and open. How do you calculate pipeline conversion? Ask ChatGPT’s ADA.
CREATING CUSTOM CALCULATIONS IN ADA
One of the things I’ve learned is to be very very specific – especially when creating what is essentially a custom calculation. Here is the prompt I used:
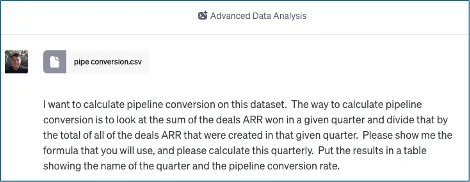
As you can see – I clearly defined exactly how I wanted the calculation to work. This is really important – the first few times I tried this, I was pretty vague – but I learned that if you are super explicit, then ChatGPT’s ADA will give you exactly what you want.
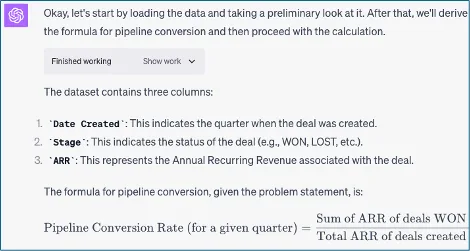
That’s exactly what I wanted to happen. ChatGPT’s ADA also showed me the exact formula it was using (I did ask for this in my custom instruction) – and the results were the following:
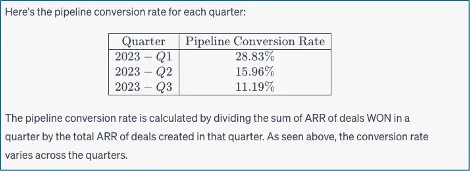
The numbers are correct and exactly what I am looking for. I can use this to look at win/loss ratios, attainment, sales productivity, NRR, etc. As long as you know how to properly formulate the question – you can get amazing results.
I also decided to ask ADA to create a chart for me, and this was the result:
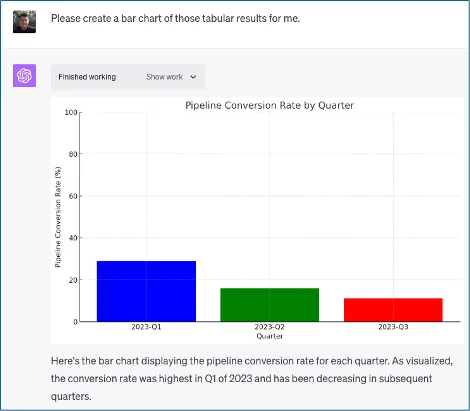
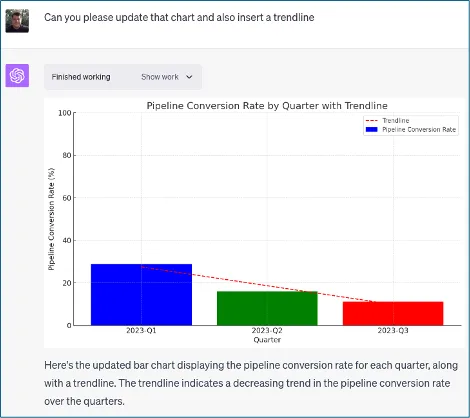
Last – I asked ADA if it could add a trendline to the cart. That was pretty easy and here is the result:
I hope that you found this example useful. Advanced Data Analytics has access to 352 Python libraries as of this writing (here’s a link to 340 of them – tinyurl.com/4xhmreuy – trying to get the most updated list). Every day it seems more gets added, and the capabilities continue to grow.
I hope you enjoyed this. Being able to create custom formulas is AMAZING. I encourage you to experiment with ADA and post great examples so the community can learn. If there’s anything that I can do to help your RevOps teams – please let me know!
As always, it ends with a picture of Ollie. Here he is, chilling on the edge of the jacuzzi two nights ago.

Best,
Steve