Pipeline is lifeline

Pipeline is lifeline. Every sales organization in the world lives by that mantra. Understanding what’s happening to your pipeline – how much is coming in, how fast it’s moving through each stage of the funnel, how much is converting to closed won are some of the most important questions a RevOps organization can help answer.
Before we jump into looking at pipeline conversion – it’s helpful to define a few terms. I’ve been in many organizations where people use terms like win rate, win/loss rate and pipeline conversion interchangeably and often incorrectly. It’s important that we start with a baseline definition of what these terms really mean so we can drive forward in the analysis.
Let’s say that a company has been creating new pipeline per quarter like the table below (# of new deals and $ARR associated with those deals):
Think of the deals created in each quarter as a cohort (so you have cohort Q1, cohort Q2, etc). When we look at pipeline conversion – we want to measure the conversion of a specific pipeline cohort (so pipeline created in a specified time period) over a given time period.
Let’s say we’re now a year later (we are in Q1 of the following year) and we want to understand how pipeline converted last year (we’re going to look at conversion to closed won although you could look at conversion to various stages which we will talk about later).
To this table I’ve added two new rows. The # of deals from each cohort quarter that were closed won through today and the $ARR value of those deals.
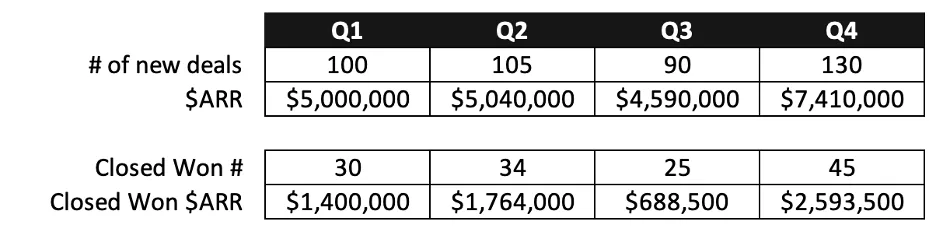
So I added two rows of that shows the number of deals and $ARR from each cohort that have been closed won through today. So you end up with a table and conversion rates that look like the following:
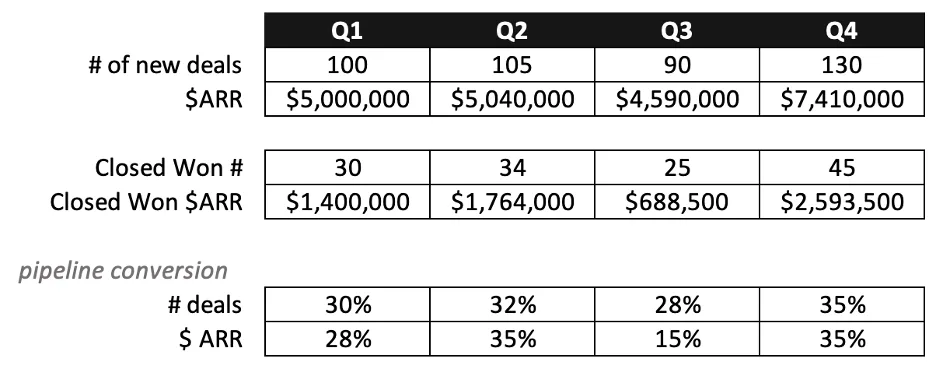
So I want to call out an important point here – it’s important to look at pipeline conversion in both # of deals and in $ARR – but the $ARR conversion rate is more important because you use it for forecasting purposes and digging in to it gives you a better sense of your business. You’ll notice that in most quarters the numbers in this example are fairly close which is a good thing – but in Q3 there was a divergence. The ARR % closed was significantly lower than other quarters. 15% versus compared to other quarters where the average is around 33%. Something happened that quarter and you’ll want to find out why. Did only small deals close? Did the type of deals change? Did the source of the deals change? These are important questions to go look at when you look at pipeline conversion this way.
Before we turn to win/loss for a minute – I want to make an important note. Pipeline conversion (to closed lost) is a multi-quarter metric. We’re looking at all of the pipeline that was created from a certain time period (e.g. a cohort) through a certain time period (typically across multiple quarters). You will also notice a pattern of how conversion rates change over time that we’ll look at later. Win-rate % as you’ll see is a single quarter metric.

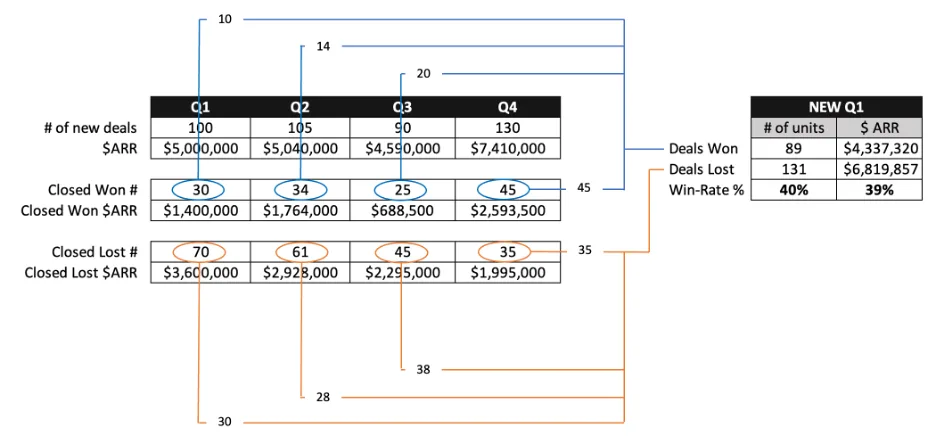
But let’s turn to win/loss (or win-rate %) for a minute. Win-rate % is a measure of how much business was closed won in a certain time period (say this current Q1). The formula is simply all of the deals that were won/(won+loss). But the important note is that the deals could have been created in any quarter (not just a single quarter) – but the win/loss measure happens in a single quarter.
To graphically show this – we’ll use the same table from above – and show of each of the deals that we’re won and lost from a particular quarter – how many of those were either closed won or closed lost in Q1 of this year.
For example – from the 100 new pipeline deals created in Q1 of last year, 30 were closed won and 10 were closed won in Q1 of this year. Similarly, of the 34 closed won deals from Q2 last year, 14 of those were closed in Q1 of this year. You can do the same thing with the lost deals and then do the same thing with closed won and closed lost $ARR.
Ok – back to pipeline conversion. Looking at this pipeline conversion table again:

It’s helpful to look at the trend over time – but it’s really important to dig into the underlying numbers a lot more. Let’s assume that you have three main sales segments, SMB, majors and enterprise. Let’s also assume that you have three potential sources of pipeline (in reality you’ll probably have many more) – marketing, channel partner and self-gen.
The first thing to do is peel apart the pipeline conversion by sales segment and start tracking that to see what’s happening.
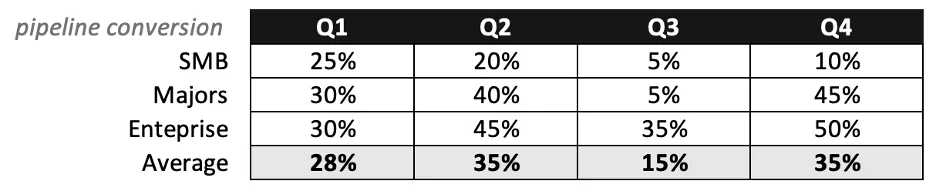
In this example – Q1 and looks OK, Q2 overall went up really nicely but you notice a little downturn in SMB – but unless you split apart the segments – you wouldn’t have noticed that.
Now let’s turn to Q3 – a trainwreck all around – but really bad for SMB and Majors. We need to find out what’s going on there. Q4 saw a nice turnaround overall back to 35% in aggregate with strong performance in 2 of the 3 segments – but there’s clearly some longer term issues going on with SMB.
Let’s drill down into the SMB segment to see if we can find out more about what’s happening.
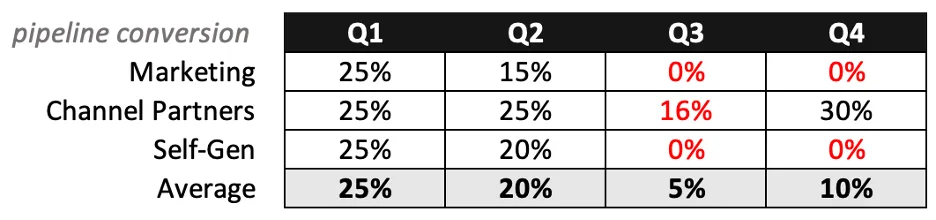
Something clearly shifted in Q3 in marketing and self-gen. Given that Q3 was weak across all segments – there may be something more macro going on there – but you need to drill in like this to start to identify what the problem really is. Clearly the fact that we had 0% conversion on marketing and self-gen pipeline for two quarters in a row would be a major red flag. Did we change something in the qualification process? Did we get new sources of leads? Have we turned over the majority of the sales staff? We need to find out what’s happening – but that’s a challenge for another day.
I hope this helps bring a little more clarity to pipeline conversion and why it’s so important. A couple of key final points to wrap:
· Pipeline conversion takes a cohort of deals and looks at close rates (in this example) over multiple quarters
· The most important metric to measure pipeline conversion on is $ARR
· It’s critical to look at pipeline conversion over time to understand trends
· Once you look at pipeline conversion at the macro level, it’s essential to look at it by sales segment, by pipeline source, and then the combination of sales segment and pipeline source.
· Some people want to look at pipeline conversion more frequently than quarterly but I’ve found that if you try to do intra-quarter measures (say monthly) – you can get extremely wonky results (one reason may be that the majority of deals closed in the last month of a quarter so if you are measuring in M1 or M2 you won’t get the right picture). Stick to quarters and be consistent in how you measure it
· Educate your company on the difference between pipeline conversion and win-loss and why you use those two measures (it will save a lot of headaches later). You should also look for good benchmarks in your industry and compare yourself (are you better, worse, average) – and are you increasing, decreasing or holding constant quarter over quarter
· Whatever BI system you are using (e.g. Tableau) – automate the reports so that they are done automatically and consistently every quarter
It’s been raining cats and dogs here in the Los Angeles area today. Here’s how Ollie stay warm after a walk in the rain: