I have been using Excel for 30+ years
File this one under quick excel tips and tricks.
I’ve been using excel since, oh, it seems like the dawn of time. In reality, the first spreadsheet I used was VisiCalc (around 1981). I then moved to Lotus 1-2-3 around 1985, and ultimately switched to Excel around 1990 and have loved it ever since. What a long strange journey it’s been. While I do use google sheets today for various things – I’m still an Excel person at heart and it’s my default tool when I start a new analysis.
Having developed more spreadsheets than I could possibly count and having downloaded more salesforce reports into excel than should be legally allowed, I’ve learned a couple of tips to help with analysis. I’ve been sharing these with folks as I come across them and I see them struggling - so I figured I’d share a few tips here too. These will not be my normal in-depth articles – but quick and simple tutorials to make your life easier.
Today we’ll focus on two things: the first is mapping items into fiscal quarters when you only have dates, and the second, a way to get insights when you have multiple date fields on a single row and some “blank data” (e.g. how many MQL’s turned into SAL’s and how many SAL’s turned into SQL’s).
Let’s start with the first one. Let’s say you have a dataset and you have 20,000 lead records and someone didn’t put in the fiscal quarter (or the report creator forgot to add it). You could I suppose sort the dates in order and manually start entering things like 2022 Q1 and then copy and paste it until you get until the dates that correspond with 2022 Q2, etc. But there’s an easier way.
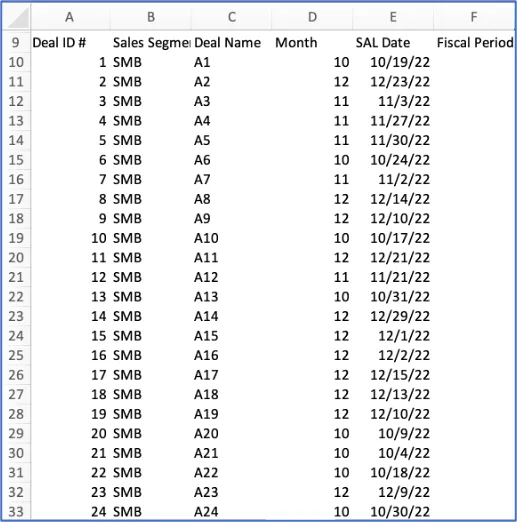
The top of your dataset looks like this:
You could create a lookup table that has every date for the year and look up that way, but there’s a much quicker way. Vlookup let’s you look for dates and get an approximate match – which works perfect for this. Start by creating a table that has the first date of the quarter you want to match for and go through the last date.
It would look like this:
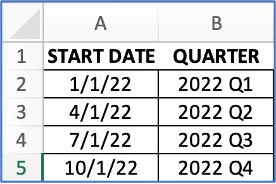
The formula you want to put in cell F10 above is: =VLOOKUP(E10,$A$2:$B$5,2,TRUE)
You’re looking up the SAL date and then referencing the short table. Any date that’s between 1/1/22 and 3/31/22 will pull in 2022 Q1, any date that’s between 4/1/22 and 6/30/22 will pull in 2022 Q2, etc. The secret is having the ”TRUE” flag at the end of the vlookup. It’ll look for the approximate match and it works perfect for dates like this. I can’t tell you how many tables I’ve had where I have tens of thousands of rows of data a set of dates from say 2018-2024 with the quarters like this and it saves me tons of work.
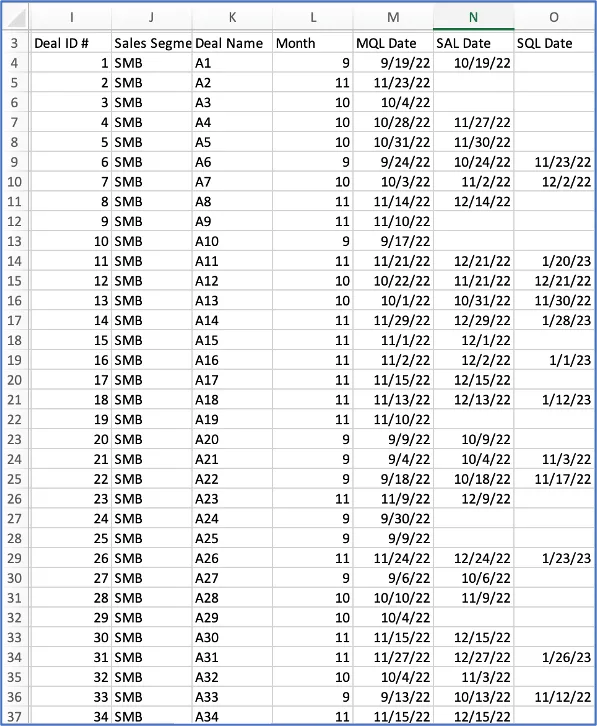
Let’s turn to tip #2. Let’s say that you have a table with thousands of deals and you have MQL dates, SAL dates and SQL dates. We all know that not every MQL turns into an SAL, and not every SAL turns into a SQL. If your data looks like this though, how easy it is to quickly understand what conversion looks like?
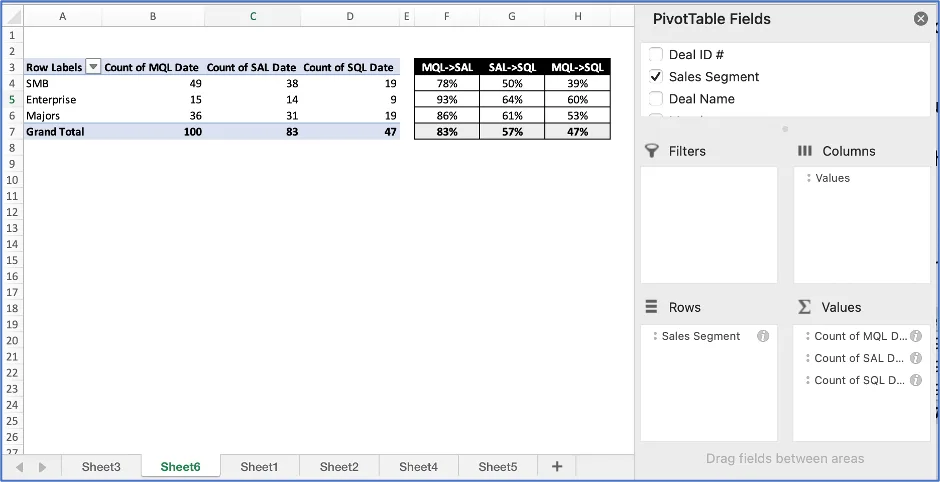
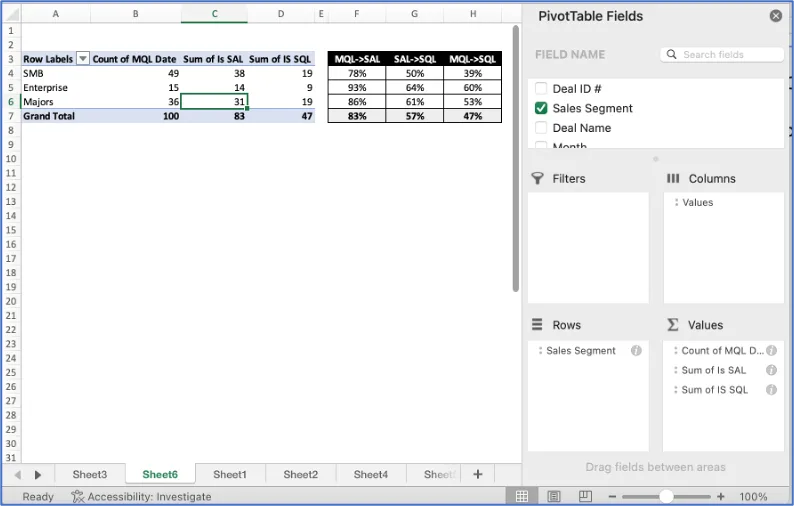
What you want is a pivot table that looks like this (I grouped these by sales segment). You have the counts and then you can quickly calculate the conversion rates.

It’s a really simple pivot table to make:
But – the challenge I’ve often come across – is that the “blank” fields in the datasets aren’t really blank. They have a null space in them or some format that makes excel count them as not empty. And when that happens and you try and create the same pivot table as above – you get this as a result.

Obviously not helpful, and obviously not correct. So if you are getting results like that – you either have the greatest business on planet earth, or there is a problem you have to solve. You can try and clear up the formatting, but I’ve found a quicker way is to simply add a column (or two) with a simple calculation.
Add a column like “Is SAL” and “Is SQL” so your dataset looks like this:
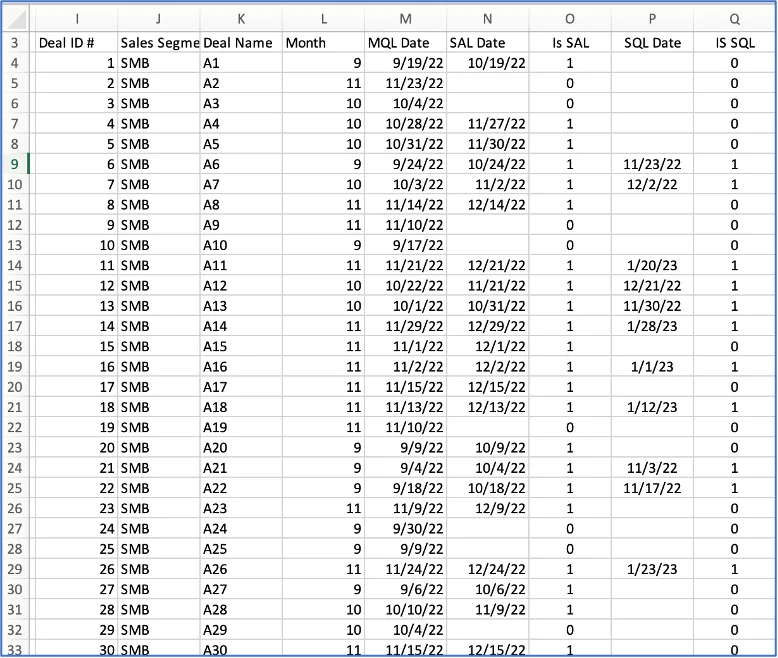
The formula for the cells in that column is really simple – for example – in cell O4, the formula would be: =If(N4<>””,1,0)
That’s it. Copy it down. Then do the same thing in column Q. In cell Q4, the formula would be: =IF(P4<>””,1,0) and copy it down
Then you can create the same pivot table using those fields instead and get an accurate account.
Anyhow – that’s it for the day – I hope you found this useful. I know there are new functions like xlookup – but this isn’t meant to be a detailed excel tutorial. ;) If you spend as much time in excel as I do – shortcuts matter. I don’t know why there are so many datasets I get where date fields have odd formatting – but I’ve found that this solves that issue and let’s me get on with my day.
Oh yeah – here’s another picture of Ollie.

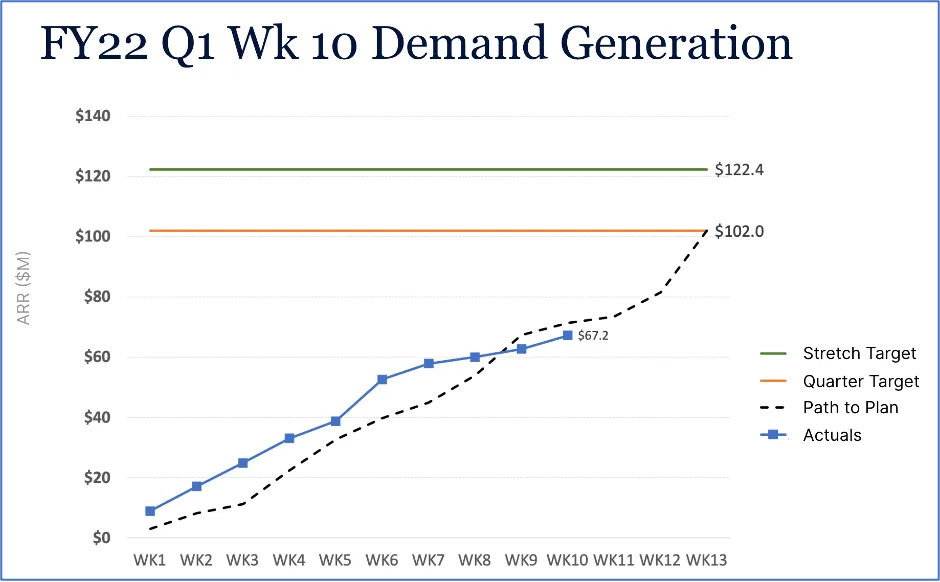
Sometime later this month we’ll get in to one of favorite topics – how to track pipeline across a quarter showing progress week by week against a path-to-plan (based on historical data and seasonality) so you can really understand if you’re tracking or not. We will also talk about what makes good chart design.
Now that will be fun. See you then.