ChatGPT's Code Interpreter is going to change your life

The question now is how quickly these changes become a daily part of our workflow. This week I’m going to give you a quick peek into some real examples of the new ChatGPT code interpreter and the just-launched Claude 2.0 can have a real and immediate impact on a RevOps and marketing ops organization.
So, what is the new ChatGPT code interpreter? The ChatGPT Code Interpreter is a new feature that allows you to run Python code within a chat with ChatGPT, with additional options to upload and download files. You can use it to perform various tasks, such as data analysis, image processing, video editing, and more. You can also ask ChatGPT to write or modify code for you or explain how the code works. The ChatGPT Code Interpreter is a powerful and versatile tool that can help you with many tasks and projects. You can use it to learn Python, create art and music, solve problems, explore data, and more.
Many of you are probably thinking – I don’t know anything about Python – why would I care about that? Don’t worry about Python. Trust me. It’s what code interpreter can do – not how it does it. That’s what makes this so powerful. Instead of trying to explain why you should care – let me give you a few real-world examples.
This week, in addition to giving you screenshots of what’s going on – I’ve also created a video to show you in real-time how this works.
Watch the full video for all these demos here
Example #1: Analyzing trends in RevOps data
You’re on the RevOps team, and you get a file that looks like this.
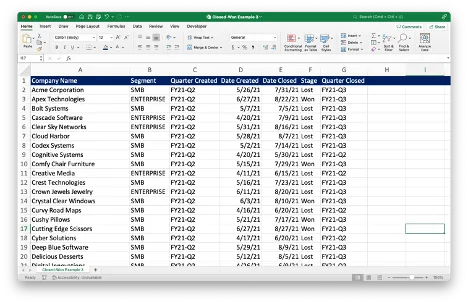
You want to do some analysis to understand the number of opportunities per quarter, the percentage of deals won by quarter, and the percentage of deals won by segment by quarter. You could just do some pivot tables – but with ChatGPT code interpreter - there is a much easier way.
You can upload this file into ChatGPT and ask code interpreter to give you a description of the dataset and some initial insights. After you upload the file – ChatGPT gives you the following summary.
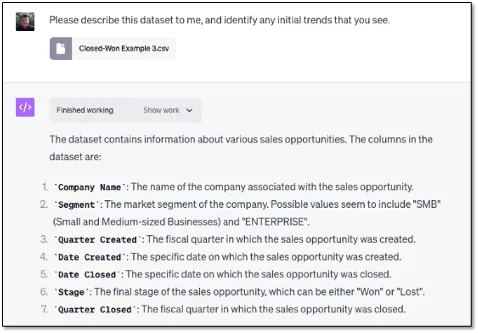
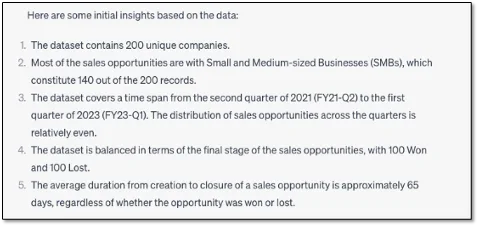
As you can see – it identified all of the fields in the spreadsheet and created definitions that are fairly accurate. It then identified some initial insights in that data. As you can see – it provides a very quick and accurate summary of what’s in there.
It then went on to create a number of charts based on the insights it’s seeing, with a small description below with initial insights.
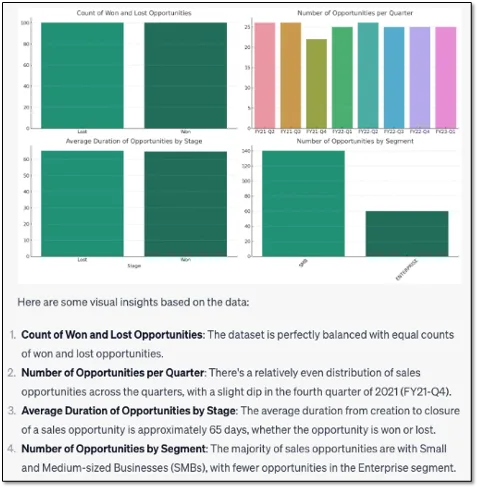
Note that I didn’t tell ChatGPT what to do – I simply asked it for any insights it could create.
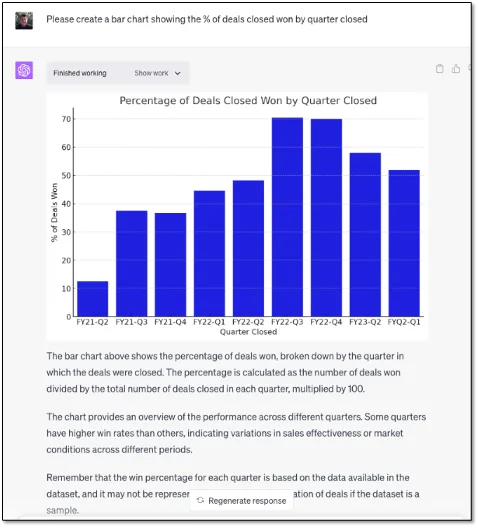
What I want to do now, though, is direct ChatGPT what to do – and you can see in this example here – I asked it to create a bar chart of the percentage of closed won deals by quarter. Here’s what it created.
I then asked for a further enhancement – to turn it into a line chart and show me the numbers also by segment.
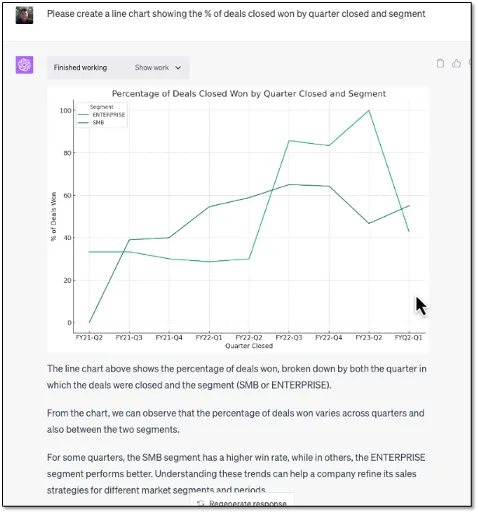
What’s so powerful about this is that it let’s you do analysis using very natural language in a way that anyone can understand. It’s still early days and you may have to experiment to get your question exactly right – but it’s extremely powerful and saves a tremendous amount of time in trying to do analysis.
Example #2: Adding some source data from the marketing team
Let’s say that someone on the marketing team downloaded a file that looks like this. Not a whole lot of data, and it would be difficult to do much analysis with this. But – with code interpreter – you can ask ChatGPT to combine this file with the previous one and do an analysis on it.
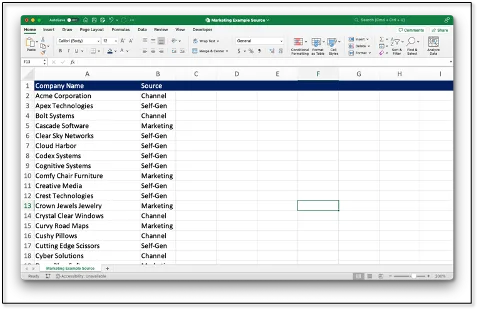
After uploading this additional file and asking it to combine it with the previous one and look for trends – ChatGPT came back with this.
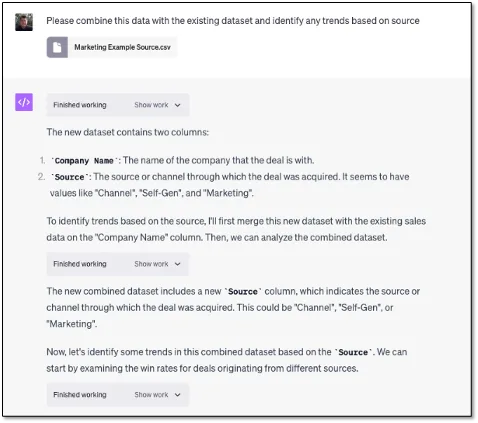
It identified the fields and automatically figured out that the company name can be used to merge this data with the prior spreadsheet and did so. It also tells you that it’s going to look for trends now based on the source.
Here’s the first thing it came back with – info on win rates by source.
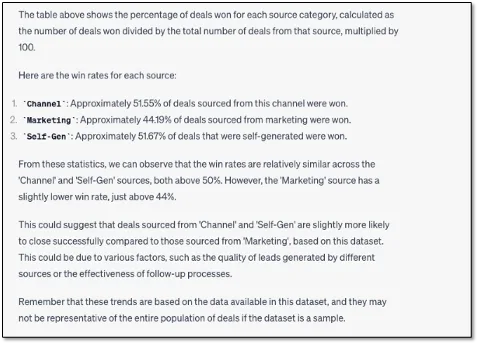
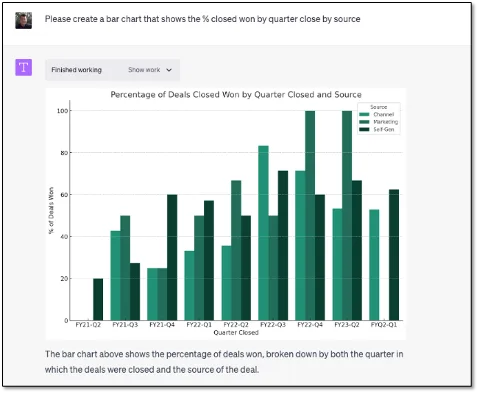
That’s interesting, but I’d like more. So, I asked ChatGPT to create a bar chart that shows the % closed won by quarter close and source. It instantly creates the chart I’m looking for.
I then asked it to do a line chart showing the average age of closed won deals by quarter close and segment. If you go back and look at the spreadsheets that were uploaded, you’ll notice that there is no age field. ChatGPT needs to figure out how to calculate the average age, and it does exactly that. It shows in the text how it calculates the average age.
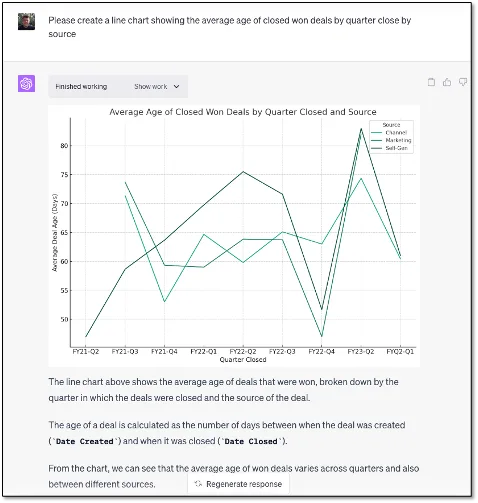
You can start to see just how much time you can save and how much more analysis you can do really quickly if you structure your queries correctly. It’s absolutely amazing what code interpreter can do, and it continues to absolutely blow me away every time I use it.
Example #3: Don’t you hate auto renewal dates? I know I do
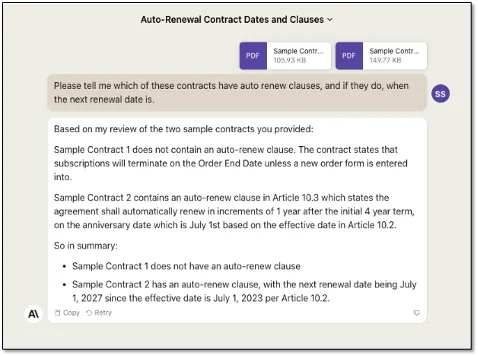
How many times have you joined a company and learned that there are tons of contracts with vendors all over the place, and people aren’t really tracking them the way they need to. Anthropic just released Claude 2.0 – their most up-to-date AI model. Claude’s strength is in text processing. In this example – I upload two PDF contracts to Claude and ask it to identify if these contracts have auto-renewal dates, and, if so, when they would be coming up. Here are the results it gave me back.
WHAT’S NEXT?
The innovation happening in AI is incredible. Every day I’m finding more and more use cases in RevOps, and we’re still at the very beginning of this AI revolution. Here’s one of the best new examples I’ve seen in conversational AI. It’s an AI that can have a full-on 10-40 minute conversation and sound like a REAL human with infinite memory, perfect recall and take actions across applications. Check out the demo here from air.ai.
I’ll keep cranking out more demos and doing research over time. If there’s something you’d like me to explore, please let me know. As always – ending with a picture of Ollie, who was keeping cool while riding around in the backseat of the Tesla.

Best,
Steve